
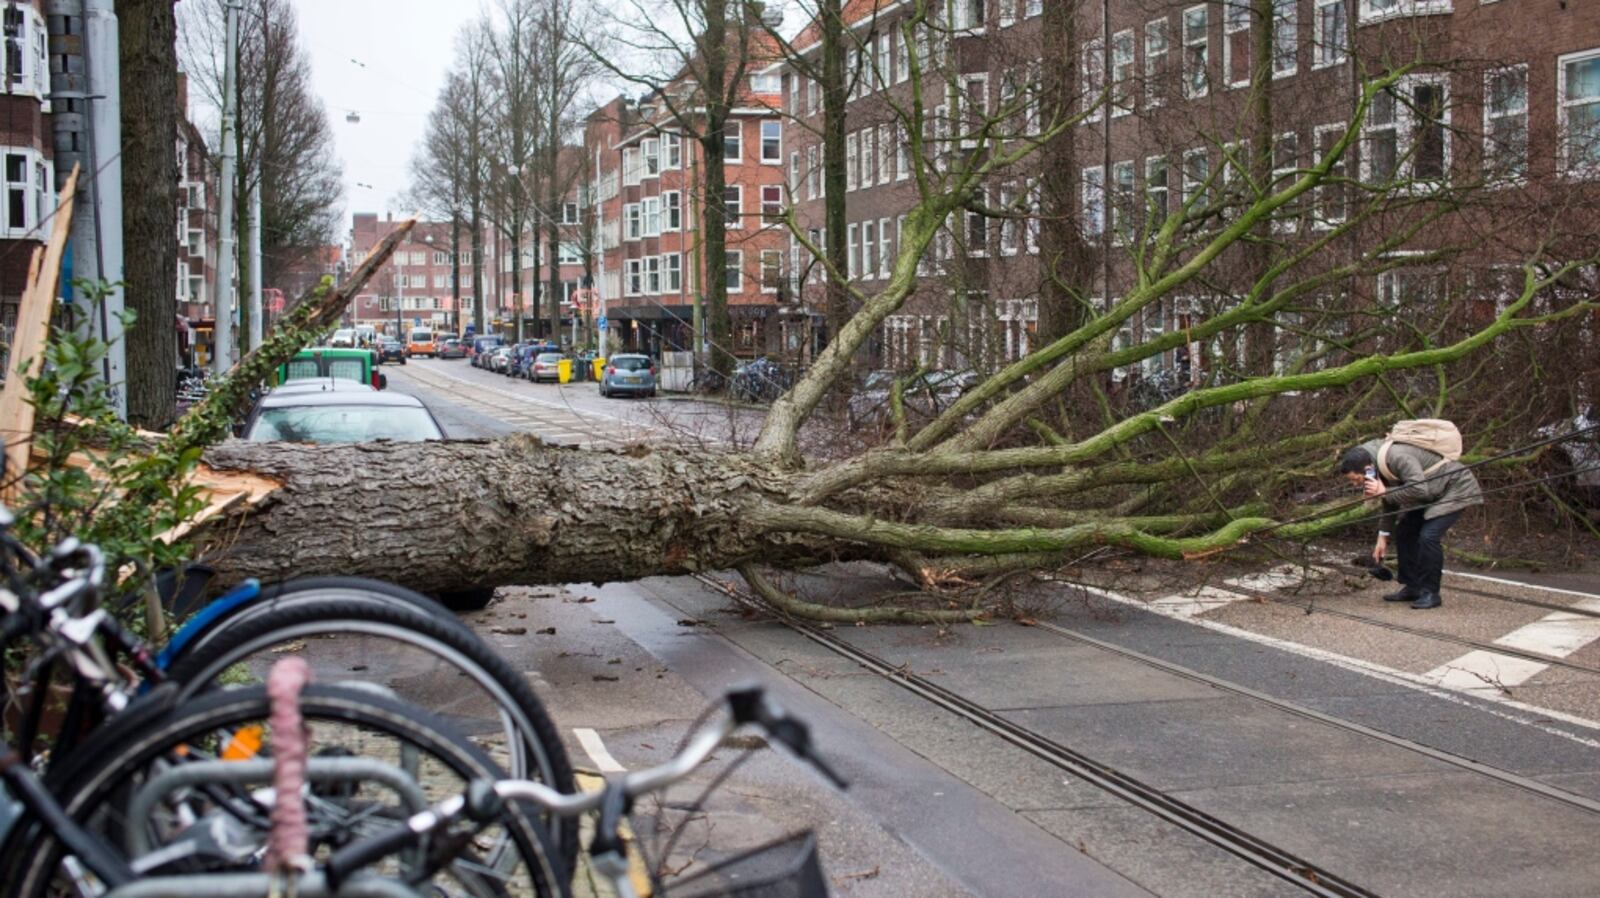
Photo by Peter Dejong
How do windstorms translate into damage and insurance claims?
A recent study of Red&Blue, conducted by the Institute for Environmental Studies (IVM) of VU Amsterdam, delves deep into this question. It focuses on the Netherlands and provides key insights into the complex relationships between wind hazard intensity and resulting losses. The scientific manuscript “Empirical evaluation of windstorm losses and meteorological variables over the Netherlands” is published in Natural Hazards.
The study uses a combination of high-resolution wind hazard data and unique insurance loss datasets from 2017 to 2021. It examines how wind characteristics, such as maximum gusts and hourly wind speeds, correlate with reported damage. The study provides a comprehensive assessment of windstorm impacts at multiple spatial scales, ranging from local postal codes to national aggregates.
Key Findings:
- Correlation between wind and damage: There was a significant association between the damage components and the maximum wind gusts, particularly those recorded at the meteorological stations. The high-resolution modeled wind speeds also showed a reasonably good correlation with damage.
- Aggregation matters: The relationship between wind speed and claims becomes more apparent when the data is aggregated from 4-digit postal codes to the national level, with a stronger relationship at the two-digit postal code level and beyond.
- Threshold effects: When wind speeds go over about 22 m/s (the 98th percentile), losses and claims go up sharply. Still, lower wind speeds also cause considerable damage at the national level.
Implications for Insurance and Risk Management
Detailed information on wind speed and the localized damages it can cause is not always available. With this study, we have explored the different spatial aggregations, going from detailed information at the neighborhoods level (4-digit postal code) to less detailed information at a national level. Therefore, our results can help different stakeholders, such as insurers or policymakers, to determine the level of detail that is needed based on the purpose of the analysis. For example, for an insurance company, an analysis at national level with less detailed information may be enough for determining the risk of a portfolio, whereas for pricing premiums, a more detailed analysis is needed. Similarly, policyholders may use different levels of detail for their analyses. For example, to improve preparedness, an analysis at a regional level is needed to determine the provinces with major risk, when, and how intense a windstorm event could occur and the consequences they may expect.
This research highlights the importance of understanding the dynamics of windstorms for assessing and managing risks. By identifying thresholds and correlations between hazard variables and damage variables, insurers and policymakers can better anticipate potential losses and design more effective strategies to mitigate the impacts of storms.
Stay tuned as these insights pave the way for smarter, data-driven decisions in managing windstorm risks. As part of the Red&Blue project, we are developing windstorm maps for future scenarios, showing not only the expected wind speeds but also the expected damages.
The full manuscript can be found here.
For more information contact María Fonseca – m.d.s.fonseca.cerda@vu.nl


